Knowledge, Education and Expertise
Universities, research councils, think tanks, school networks and the expert establishment.
The 11 figures in this chapter are reproduced from the report of Atlas research module M7, with the passage of the study that explains each. They keep the study’s own labels and colours: RW denotes the Hindutva-aligned bloc and LW the coalition that contests it (see A Note on Terms).
53.11. Universities, departments, law and journalism schools, and foreign university India programmes
Source: Atlas research module M7, “1. Universities, departments, law and journalism schools, and foreign university India programmes”.
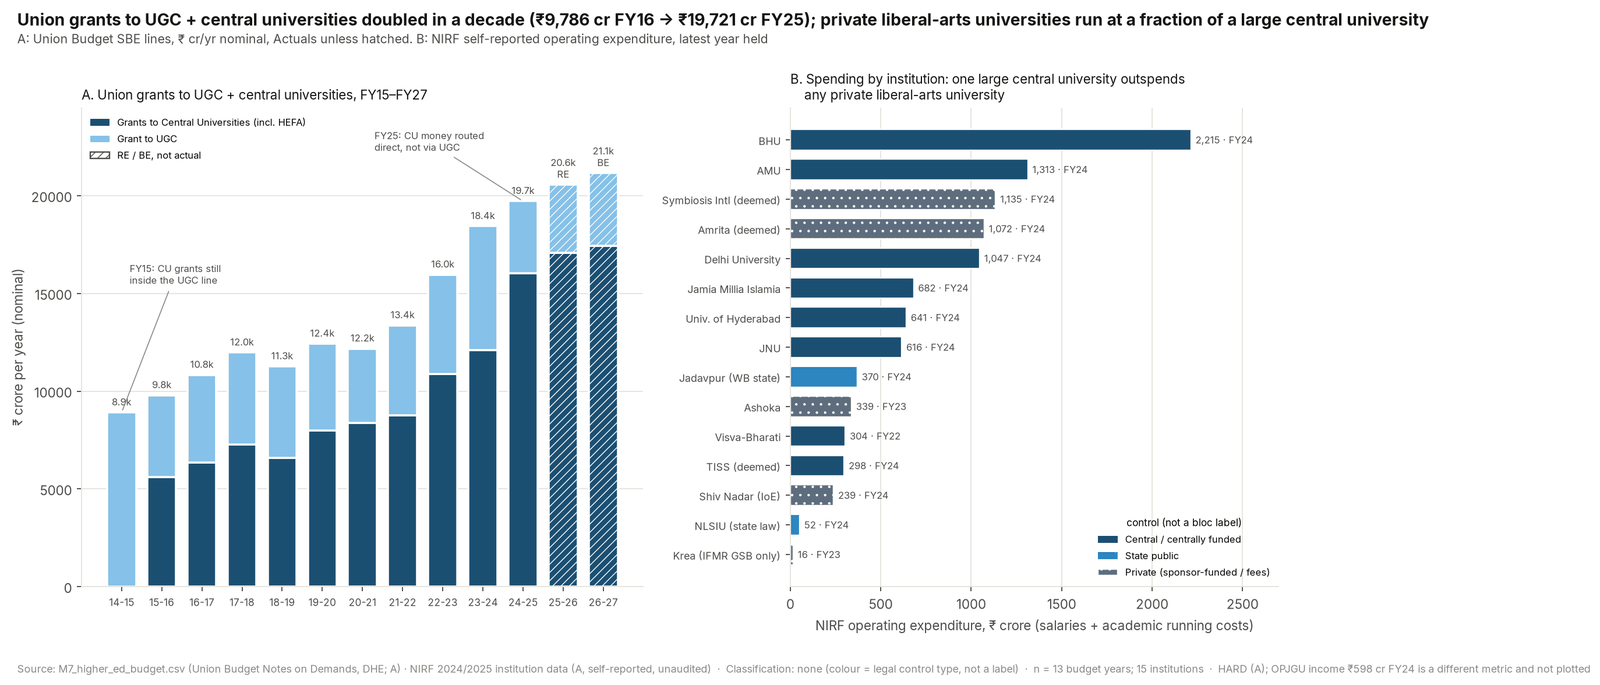
> Key findings > - Union money to universities doubled in nominal terms in a decade. Grant to UGC + Grants to Central Universities rose from ₹9,786 cr (FY16 actual) to ₹19,721 cr (FY25 actual), +102%; BE FY27 is ₹21,149 cr (DERIVED from HARD, A) [UNI-0001..0130]. The CU line alone grew ×2.86, partly by relabelling: money shifted off the UGC line in FY25, and the CU line has carried HEFA loan repayment since FY18. No deflator is in the evidence base. > - Private universities enrol a third of students; their money is mostly undisclosed. They are 546 of 1,289 universities and hold 31.9% of university enrolment (AISHE 2023-24, A) [UNI-0508..0510]. Only OPJGU has an audited-derived income figure: ₹598.47 cr in FY24, of which ₹132 cr (22.1%, DERIVED) was donations and CSR, including JSPL CSR (CARE, A) [UNI-0451, 0455]. Ashoka reports ₹2,606 cr of cumulative commitments (a stock, not receipts; C) [UNI-0487]. > - Per-university grants track size, but growth rates differ. AMU received ₹1,575.48 cr in FY24, 2.65× JNU's ₹594.50 cr, close to their enrolment ratio of 2.8× (HARD, A) [UNI-0405, 0411, 0517]. From FY21 to FY25, JNU's grant rose 72% and AMU's 6.4% (DERIVED). NIRF operating spend per student is higher at Ashoka (₹13.1 lakh, FY23) than at JNU (₹7.9 lakh) or AMU (₹6.0 lakh) (DERIVED). > - Governor–state fights over VC appointments are documented only in non-BJP-ruled states; police action against academics occurs under both. Kerala, Tamil Nadu, West Bengal, Punjab and Karnataka legislated or litigated, and six opposition-ruled states resolved against the UGC Draft Regulations 2025. No such dispute was found in a BJP-ruled state (E, absence). Police and criminal action against academics: Haryana (BJP) arrested Mahmudabad in 2025; Delhi Police acted at JNU in 2016 and against a DU teacher in 2022; MP's EOW under the INC opened a fraud case against an ex-VC in 2019 (§1.5). > - India-linked private money abroad dwarfs Indian state money for Indian studies abroad. US universities reported USD 434.9 m (₹2,767 cr) in India-attributed gifts, 1992–2025 (Section 117, DERIVED, A) [FP-110], including the ₹162.8 cr Mittal gift to Harvard [FP-053]. ICCR's chairs line is ₹12 cr (BE FY27), and its operational chairs fell from 64 (2016) to 12 (2026) [FP-085, 086, 088]. US Title VI money for South Asia centres (₹36.7 cr in FY23) ended in 2025-26 [FP-049, 052].
53.22. Research councils (ICSSR, ICHR, ICPR, IIAS, IGNCA, NMML/PMML), journals, publishers and Indic-knowledge bodies
Source: Atlas research module M7, “2. Research councils (ICSSR, ICHR, ICPR, IIAS, IGNCA, NMML/PMML), journals, publishers and Indic-knowledge bodies”.
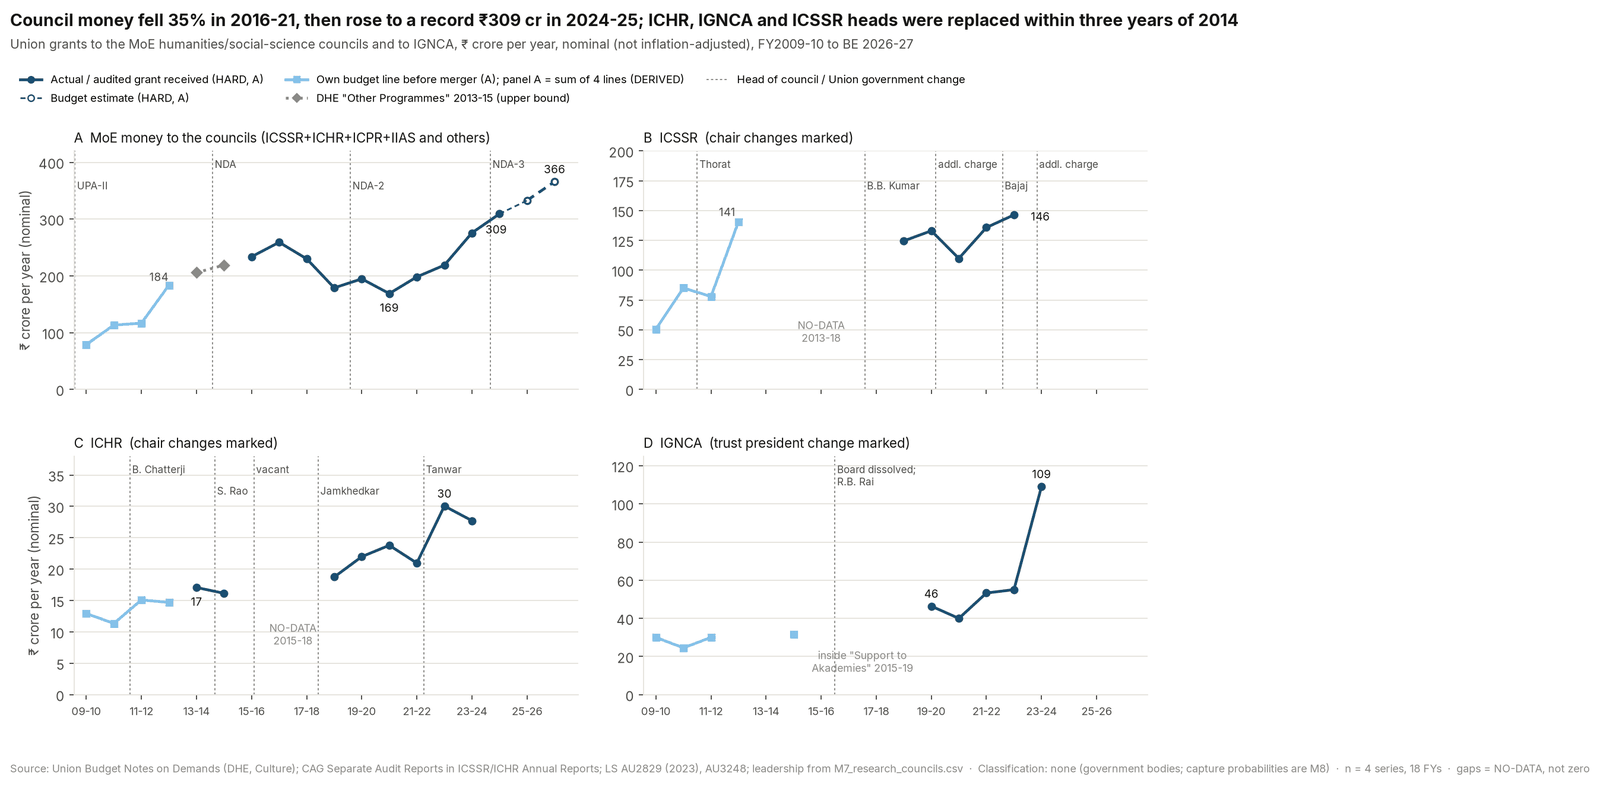
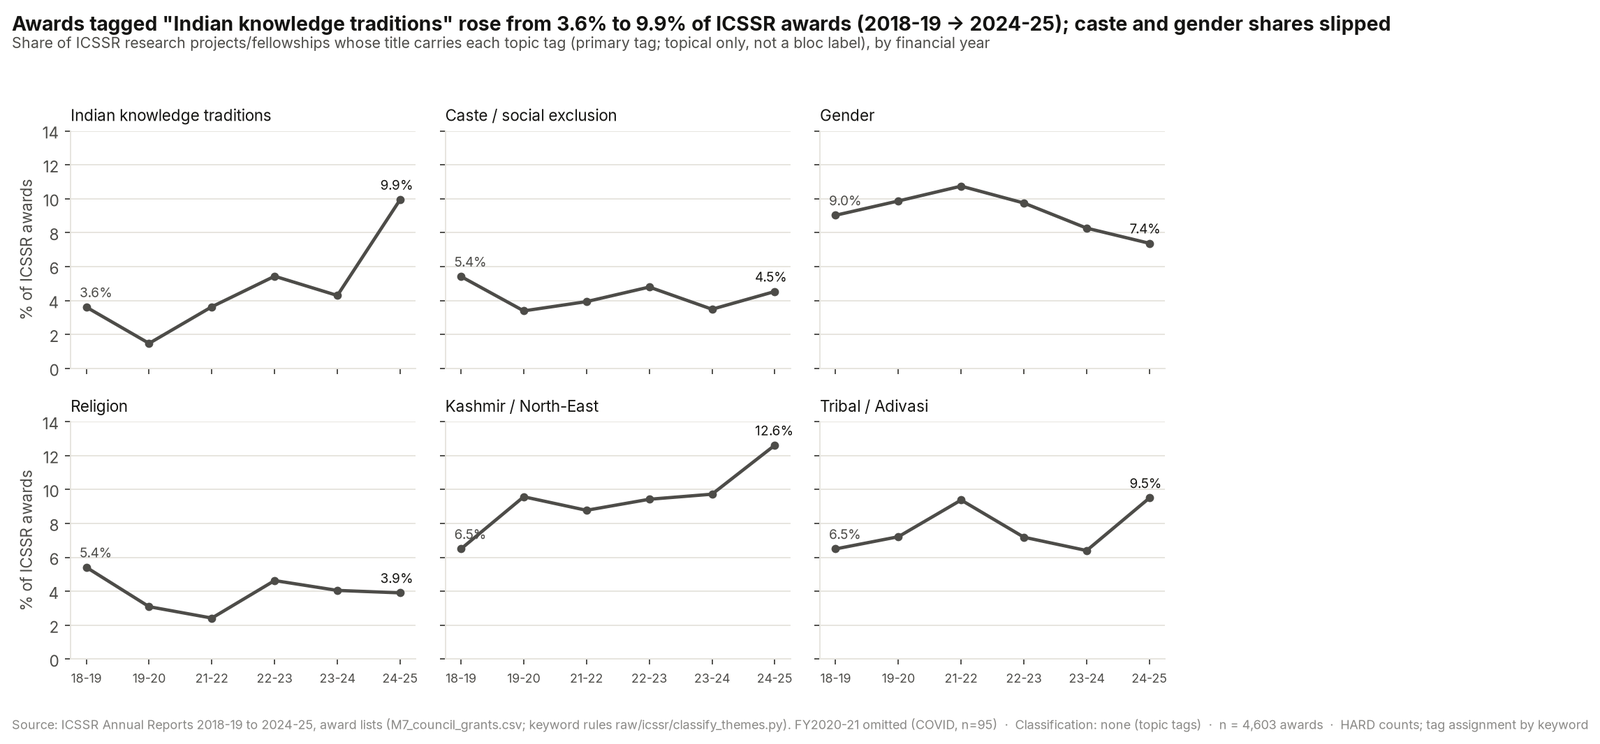
> > Compared with the ABISY standard (offices documented by the organisation or the press): five post-2014 ICHR posts were held by ABISY office-bearers, against one documented party-committee office among UPA-era council heads. > - Publisher withdrawals and pressure run in every direction. Of 21 book and publisher episodes (1988–2026): > - governments or public bodies acted in 10 (INC, Left Front, INC-NCP, BJP and J&K administrations); > - private litigants or protesters acted in 9; > - publishers or owners acted on their own in 2. > > Penguin pulped Doniger's The Hindus after a civil suit (2014). Bloomsbury withdrew Delhi Riots 2020, which Garuda then published (2020) [PUB-064, 066..068]. > - Indic-knowledge schemes spend a fraction of their approvals. > - IKS: ₹405.78 cr approved for 2025-30 (₹81 cr/yr) [PUB-247]; ₹8.35 cr spent in 2024-25 [BUD-IKS-*]. > - Gyan Bharatam: ₹482.85 cr approved for 2024-31; ₹2.63 cr spent in 2024-25 [PUB-112, 248]. > - Private presses for comparison: Gita Press sold ₹138 cr (FY26, C) [PUB-202]; Garuda Prakashan's revenue was ₹2.23 cr (FY25) [PUB-266].
Source: Atlas research module M7, “2. Research councils (ICSSR, ICHR, ICPR, IIAS, IGNCA, NMML/PMML), journals, publishers and Indic-knowledge bodies”.
Figure 2.1 notes.
53.33. Think tanks (all sides): funding, staff and citation reach
Source: Atlas research module M7, “3. Think tanks (all sides): funding, staff and citation reach”.
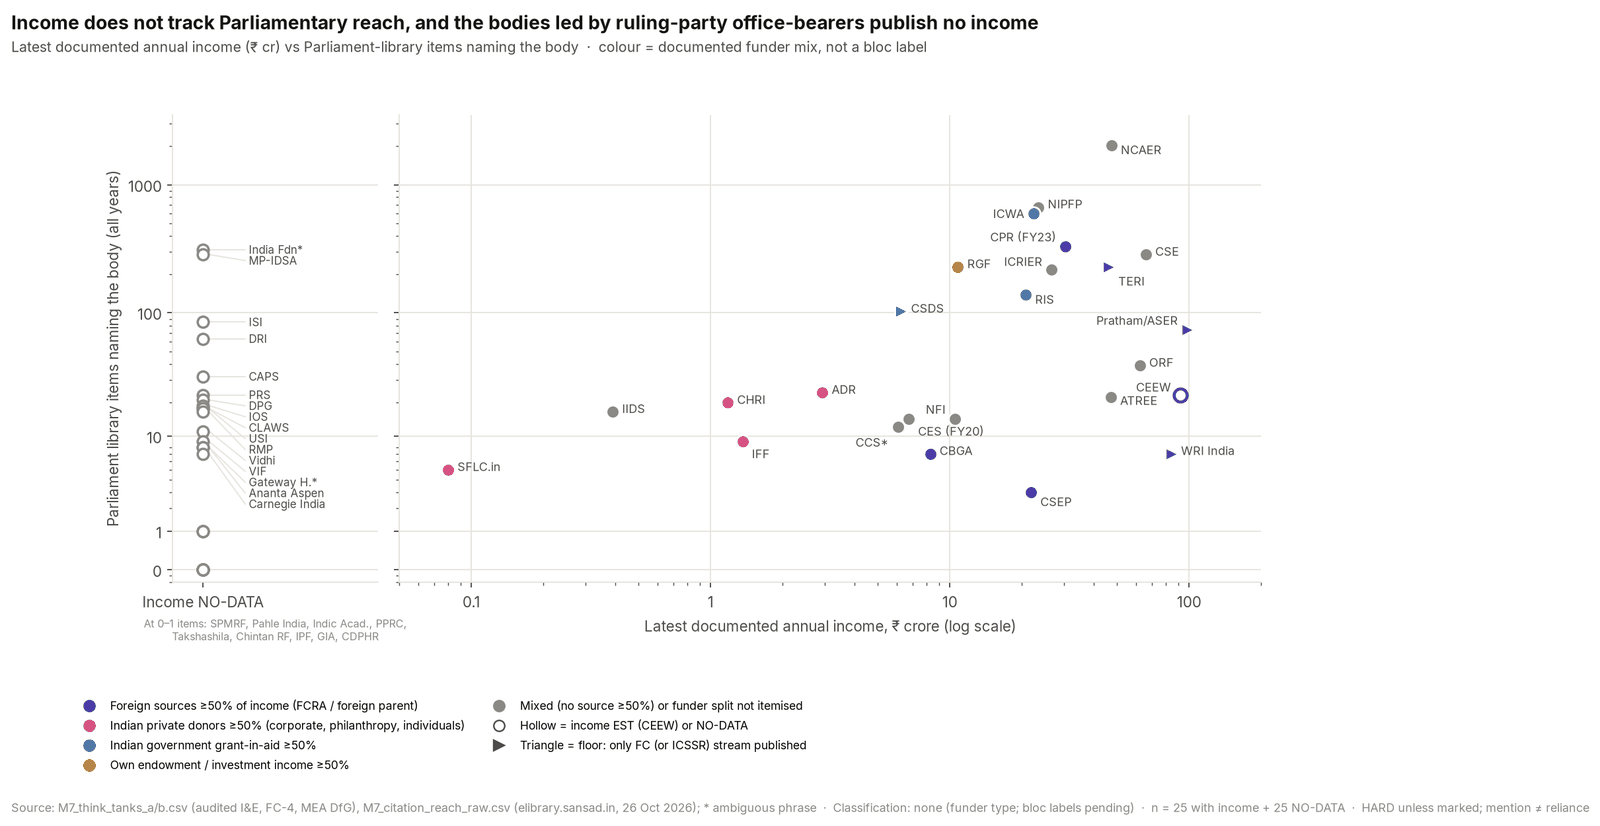
> - CPR's receipts fell from ₹30.48 cr (FY23) to ₹10.98 cr (FY24): −64%, DERIVED [TT-CPR-106, 107]. > - Zero comparable actions were found against VIF, India Foundation, SPMRF, PPRC, RMP or the LRO/GIA/Prajna Pravah group. > - The only action in the other direction came from a state: Karnataka's INC government against a Prajna Pravah conference (2026) [TTB-0354]. > - ORF, CEEW, WRI India and TERI also faced none, despite FC receipts of ₹29–91 cr/yr (ORF 47.4% foreign; CEEW ≈87%, EST). Motive is not established. > - Citation reach favours older, government-funded economic institutes. All counts HARD, grade A. > - Parliament-library items naming the body: NCAER 2,036, NIPFP 668, ICWA 594, CPR 330; ORF 38, VIF 9, SPMRF 1, PPRC 0. > - Mentions in 11 Economic Surveys: NCAER 22, NIPFP 20, CEEW 18, ORF 5, India Foundation 3, CPR 2, VIF 1; CSDS, ADR, CBGA and SPMRF 0. > - Media is the reverse: ORF appears in 22,285 GDELT articles. > - Lens-4 (source-blind title audit): 13 of 57 bodies scored. The rest had fewer than 5 directional items. > - Composites run from SPMRF +0.70, India Foundation +0.37 and VIF +0.31 to IFF −0.46, ADR −0.44, Vidhi −0.44, CHRI −0.40 and CBGA −0.40. > - ORF (−0.08) and Gateway House (−0.02) are near zero. > - These are content-lens inputs on the codebook §3 scale (−2…+2), not labels.
53.44. School networks and textbooks (NCERT/SCERT 2014–26)
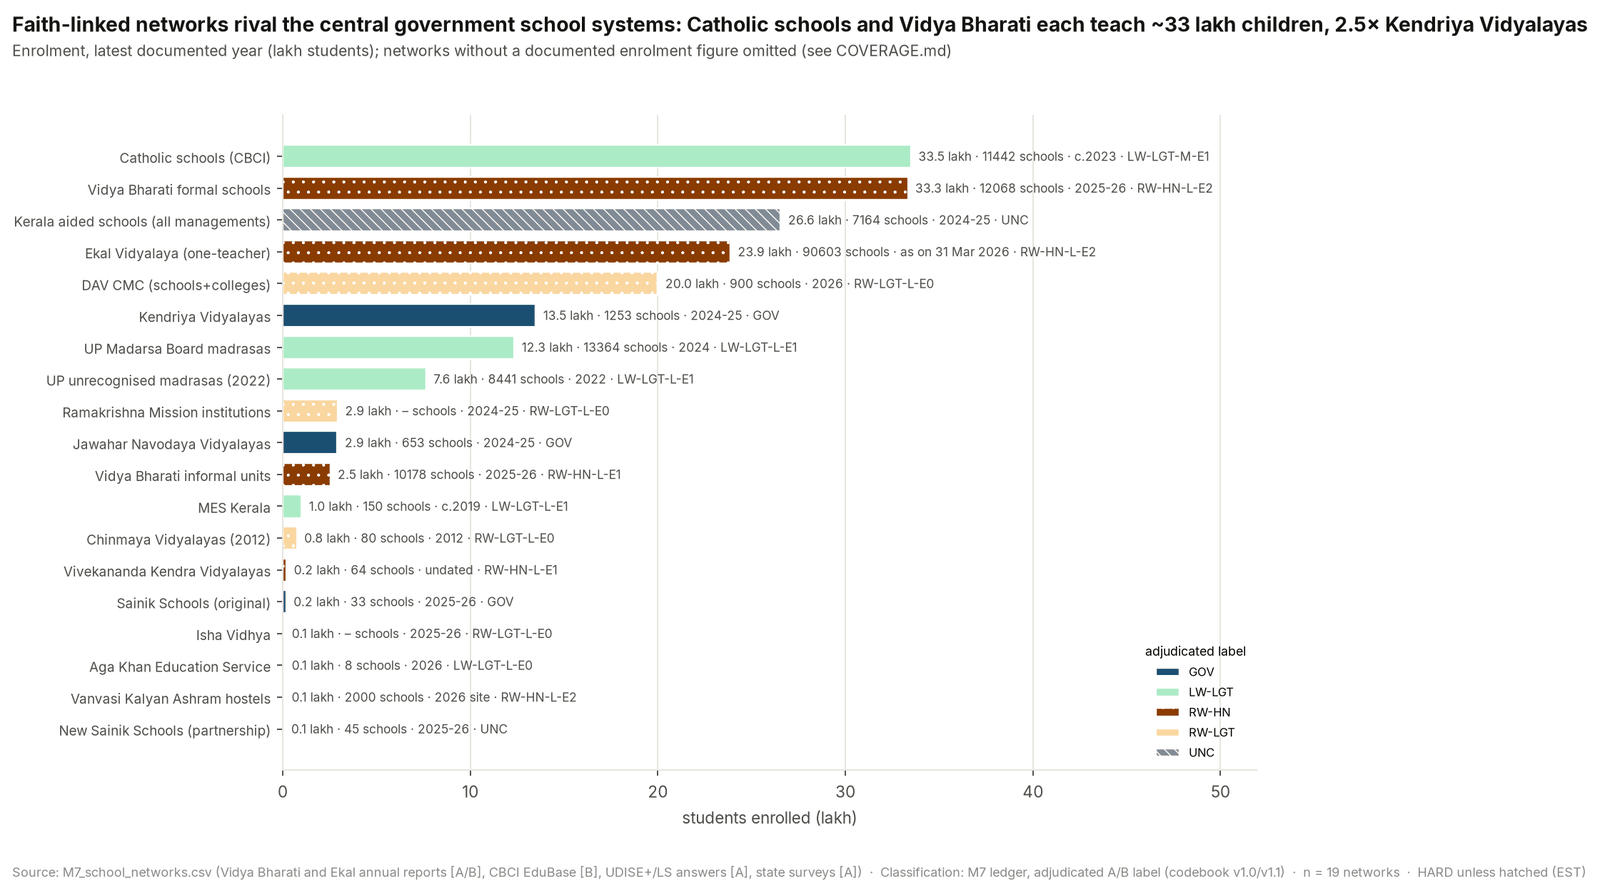
Source: Atlas research module M7, “4. School networks and textbooks (NCERT/SCERT 2014–26)”.
> Key findings > - Two faith-linked networks are each about 2.5× the size of Kendriya Vidyalayas. Vidya Bharati reports 12,068 formal schools and 33.3 lakh students (2025-26; self-reported, D, HARD as a stated figure) [SCH-056..068]. CBCI EduBase lists 11,442 Catholic "academic schools" and 33.5 lakh students (c.2023; D, an undercount by CBCI's own statement) [SCH-097, 098]. Kendriya Vidyalayas have 13.49 lakh students (UDISE+ 2024-25, A) [SCH-007]. Ratio 33.3 / 13.49 = 2.47 (DERIVED). > - Fee-funded and state-funded networks moved in opposite directions on the record. Ekal Abhiyan's consolidated income rose from ₹184.66 cr (2018-19) to ₹269.99 cr (2025-26), +46% (DERIVED from HARD, D). Of the 2025-26 figure, ₹77.62 cr (28.7%) is FCRA money [SCH-082..085]. Central madrasa-modernisation spending (SPEMM) fell from ₹295.83 cr (2015-16) to ₹0.01 cr (2023-24) (HARD, A) [SCH-035..045], while the number of recognised madrasas rose slightly, from 19,354 to 19,690 (A) [SCH-006, 032]. > - The 261 coded textbook changes split 121 RW-direction, 25 LW-direction, 99 NEU, 14 UNC and 2 other (DERIVED; double-coded A/B, Krippendorff α = 0.69 on net direction, then adjudicated). NCERT accounts for 187 rows: 84 RW, 1 LW. In the 2022 "rationalisation", 70 of 114 rows code NEU (no α–ζ content), 34 RW and 0 LW. > - State changes follow the party in power in both directions. Changes by RW-bloc state governments code RW in 37 of 44 rows; changes by LW-bloc state governments code LW in 22 of 27 rows (DERIVED). Karnataka (2022 BJP → 2023 INC) and Rajasthan (2017 BJP → 2019 INC → 2024-25 BJP) show item-by-item reversals. > - New Sainik Schools: at least 62% of the 40 MoAs signed by Dec 2023 went to schools tied to BJP politicians, RSS affiliates or other Hindu organisations. This is The Reporters' Collective's RTI-based count (C) [SCH-055]. The MoD's rebuttal (C) [SCH-071] says affiliation "does not influence the selection process". The allegation is unadjudicated.
53.55. UPSC coaching content, and elite fellowships and scholarships (T17)
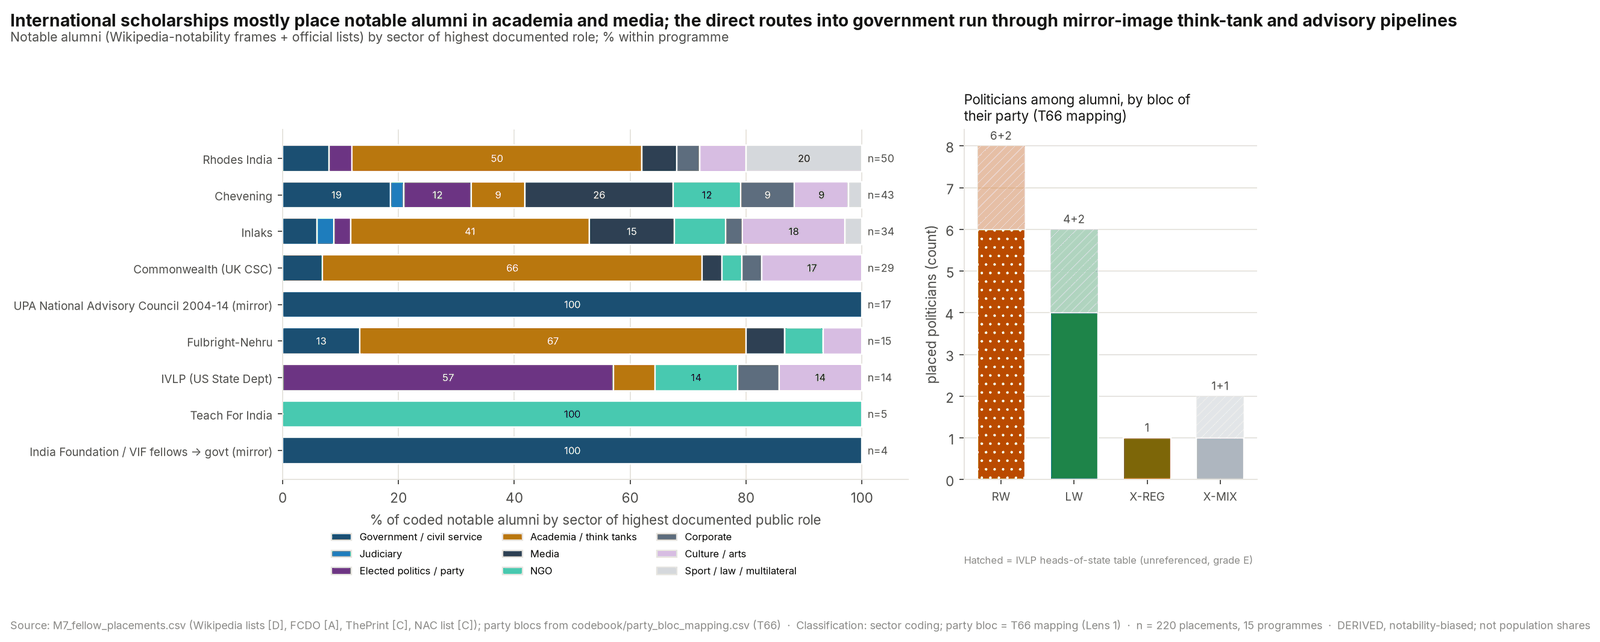
Source: Atlas research module M7, “5. UPSC coaching content, and elite fellowships and scholarships (T17)”.
> Key findings > - The coaching market is sized only from the top. GST paid in cash by commercial coaching (SAC 9992) was ₹4,792.4 cr in FY24 (C), implying ≥₹26,600 cr/yr of taxable turnover across all coaching (DERIVED: ÷ 0.18) [COA-027, 028]. The UPSC-only market is NO-DATA. The largest documented UPSC specialist, Drishti IAS, earned ₹364 cr (FY25; HARD, C) [COA-018]; Drishti plus Vision IAS (₹195 cr, E) are 2.1% of the all-coaching floor (DERIVED). > - Central minority coaching ended; the SC/OBC scheme is underspent. Naya Savera paid ₹367.20 cr for 1,19,273 students to March 2022 and was discontinued from 2022-23 because NEP 2020 "does not support coaching programs" (HARD, A) [COA-038, 160]. MoSJE free coaching spent ₹7.76 cr of a ₹47 cr BE in 2023-24 and coached 223 of 3,500 targeted (HARD, A) [COA-157]. > - The content audit (108 items, 8 providers) finds one-sided items in both directions, mostly copied from single op-eds. Statute items present both sides in ForumIAS 5/6, INSIGHTS 4/7, Drishti 10/18 [COA-173]; all 4 Operation Sindoor items give only the Indian government's account [COA-172]. Booklists: Bipan Chandra on 17 of 17 pages; Sanyal, Jain and Sampath on 0 [COA-097, 115..117] (DERIVED, C). > - Documented fellowship and scholarship spending is ₹375.1 cr/yr across 14 programmes (DERIVED, mixed years; no top-down total): Indian NGO/corporate/university ₹137.9 cr, UK/US-government and binational ₹114.7 cr, Indian governments ₹112.6 cr, Rhodes ₹10 cr. CM fellowships run under BJP, INC, AAP, DMK, LDF and NDPP governments; the largest is MP's (BJP) ₹190 cr over 3 years for 4,865 interns [FEL-0102]. > - T17: of 220 coded notable alumni, 76 (35%) are in academia/think tanks, 42 (19%) in government/judiciary, 17 (8%) in politics (DERIVED, D-heavy). Half the government placements (21 of 42) come from two mirror pipelines that are not fellowships: the UPA NAC (17, 2004-14) and VIF/India Foundation (4, post-2014). The 17 politicians map (codebook T66) to RW 6 + 2, LW 4 + 2, X-REG 1, X-MIX 1 + 1 ("+" = grade-E IVLP rows).
53.65.6 T17: Elite placement by sector and ideology (required table)
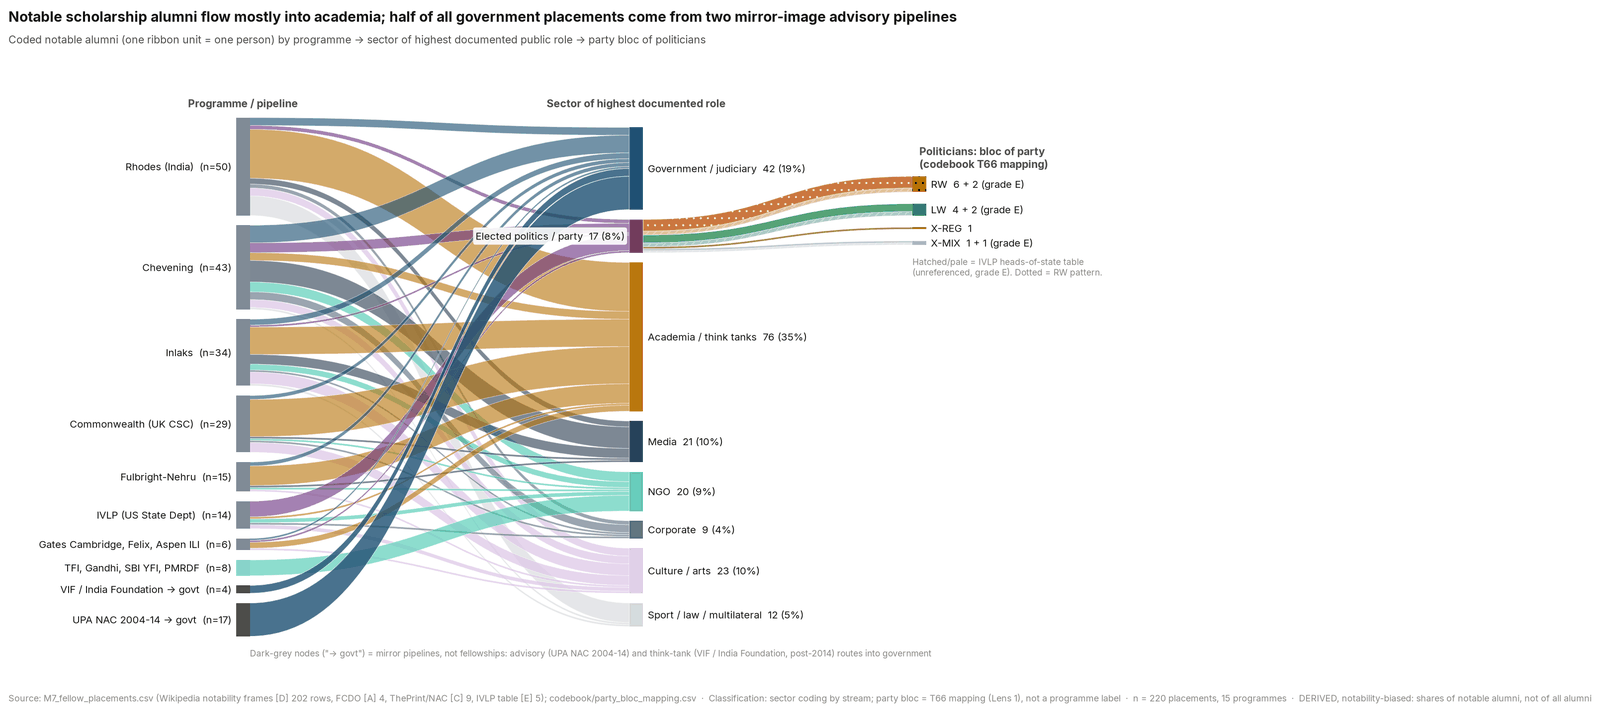
Source: Atlas research module M7, “5.6 T17: Elite placement by sector and ideology (required table)”.
Notability bias, stated. 202 of 220 rows are Wikipedia frames (D), which favour older cohorts, academics and public figures. The FCDO's own 2023 list adds 4 Chevening rows (A: Goyal, A. Patel, Narendran, Vaidyanathan): two sitting ministers, a former chief secretary and a CEO, which adds incumbent-party politicians. The IVLP frame is biased to politicians and its heads-of-state table is unreferenced (E). TFI's 5 rows are its own showcase (it self-reports "98% of placed Alumni" in education/social work). Domestic fellowships (YIF, LAMP, CMGGA, CM fellowships) publish no destinations: NO-DATA, not zero. The bloc column applies the party table mechanically; programmes take no positions [notes_fellowships §6].
53.76. Consultancies, embedded fellows and the policy-advisory market in government (D8)
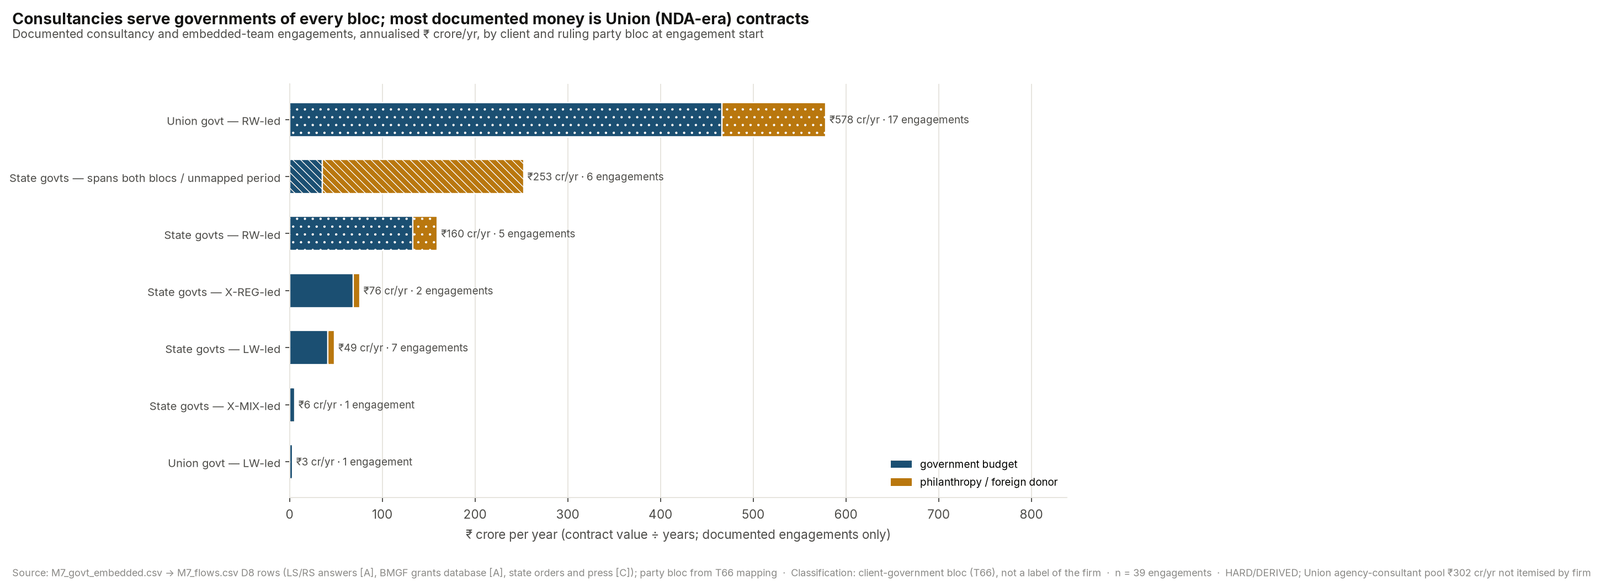
Source: Atlas research module M7, “6. Consultancies, embedded fellows and the policy-advisory market in government (D8)”.
> Key findings > - Union: ≥1,499 agency consultants in 44 departments cost ₹302 cr/yr (DoE compilation, Oct 2023, via IE RTI; HARD, C) [CONS-0111]; 23,787 further contract staff are uncosted (NO-DATA). The Big Five took 308 assignments worth ₹492.73 cr from 16 ministries, Apr 2017–Jun 2022 (DERIVED, C): PwC 156, Deloitte 130.13, EY 88.05, KPMG 68.46, McKinsey 50.09 [CONS-0136..0142]. No CAG paragraph on these fees was found. > - The same firms serve every party. BCG has clients in governments led by BJP, INC, AAP, DMK, BRS and YSRCP. Of 46 government engagements in Fig. 6.2, 25 have RW-mapped clients (13 the Union), 13 LW-mapped, 4 X-REG/X-MIX, 4 unmapped (DERIVED). Largest state figure: Deloitte's ₹120 cr bid to UP (BJP, 2022) (HARD as reported, C) [CONS-0149]. > - BMGF funds the largest embedded teams: ≈₹1,044.78 cr for Bihar (22 grants, 2011–25) and ≈₹469.16 cr for UP (10 grants, 2015–24) (DERIVED, A) [CONS-0061..0072], across JD(U)–BJP, JD(U)–RJD–INC, SP and BJP governments. No BMGF grant to a Big Four or strategy firm exists in its database [CONS-0088]. > - Unreserved hiring drew three different outcomes: the LG voided Delhi (AAP)'s 437 fellows and advisers (2023) [CONS-0134]; the Union withdrew its own 45-post lateral-entry advertisement in 3 days (2024) [CONS-0052]; NITI's YPs (95 in 2023) continue under GFR rule 178 [CONS-0119]. Lateral entry made 63 appointments (35 private sector), with no impact study (A) [CONS-0043..0049]. > - Political consultancy ≈ ₹1,500 cr/yr (EST-MAJOR, D) [CONS-0167]. Single-party outfits: BJP 4 (ABM, Varahe, Jarvis, Abhishta), INC 1 (Inclusive Minds), DMK in-house 1; cross-party 3 (I-PAC, ShowTime, DesignBoxed). Cabinet-rank strategists are documented only under INC/allied governments (Bihar 2015–17, Punjab 2021, Karnataka 2023–) [CONS-0143, 0144, 0163]; the ₹274 cr AP–I-PAC claim is ALLEGED (D) [CONS-0145].
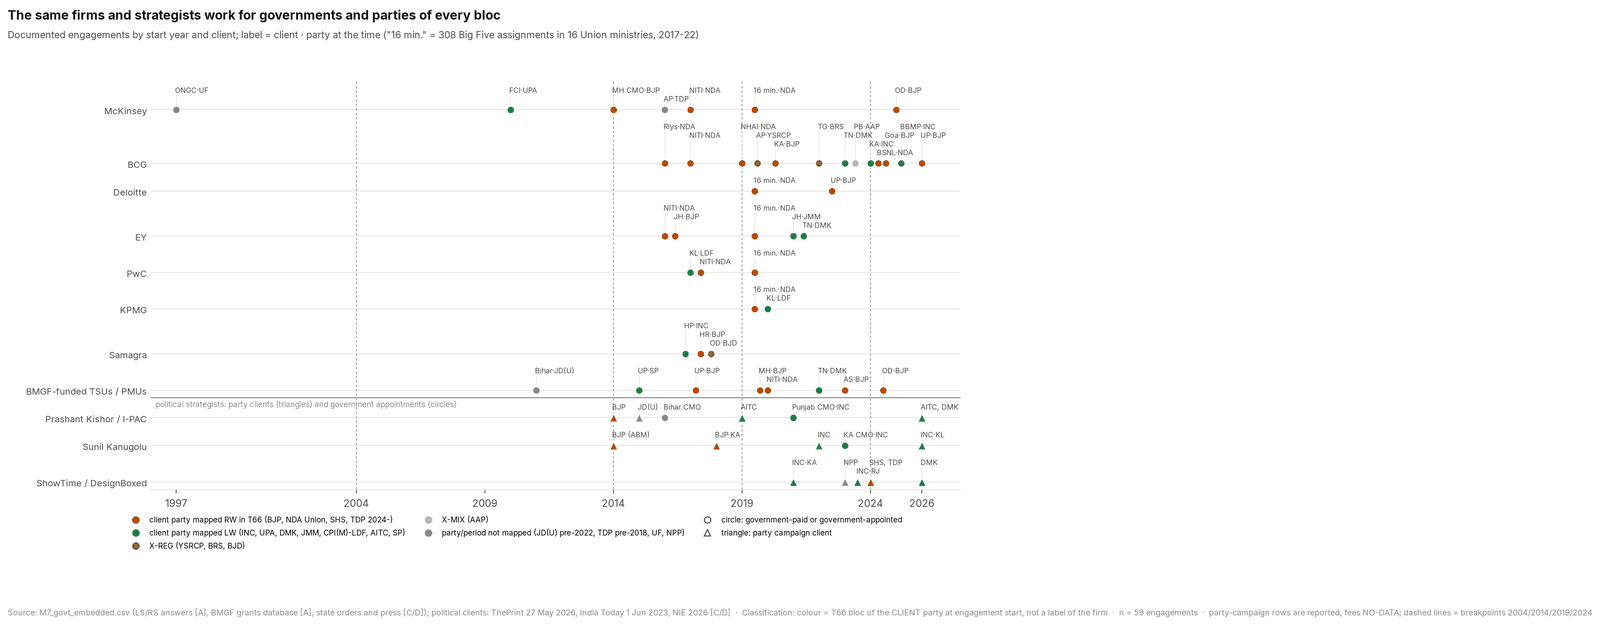
Source: Atlas research module M7, “6. Consultancies, embedded fellows and the policy-advisory market in government (D8)”.
Figure 6.1 notes. D8 flows by T66 bloc of the client's ruling party (not a firm label). The figure was regenerated after the 27 Oct flows corrections: the Union bar now carries the full ₹302 cr DoE figure, and the UP–Deloitte ₹120 cr bid is excluded as contract-total. Bars rank disclosure as much as spending.
53.87. The expert establishment: science academies, IITs/IISc, ICMR, DRDO, ISRO and whose expertise policy and courts cite (D40)
Source: Atlas research module M7, “7. The expert establishment: science academies, IITs/IISc, ICMR, DRDO, ISRO and whose expertise policy and courts cite (D40)”.
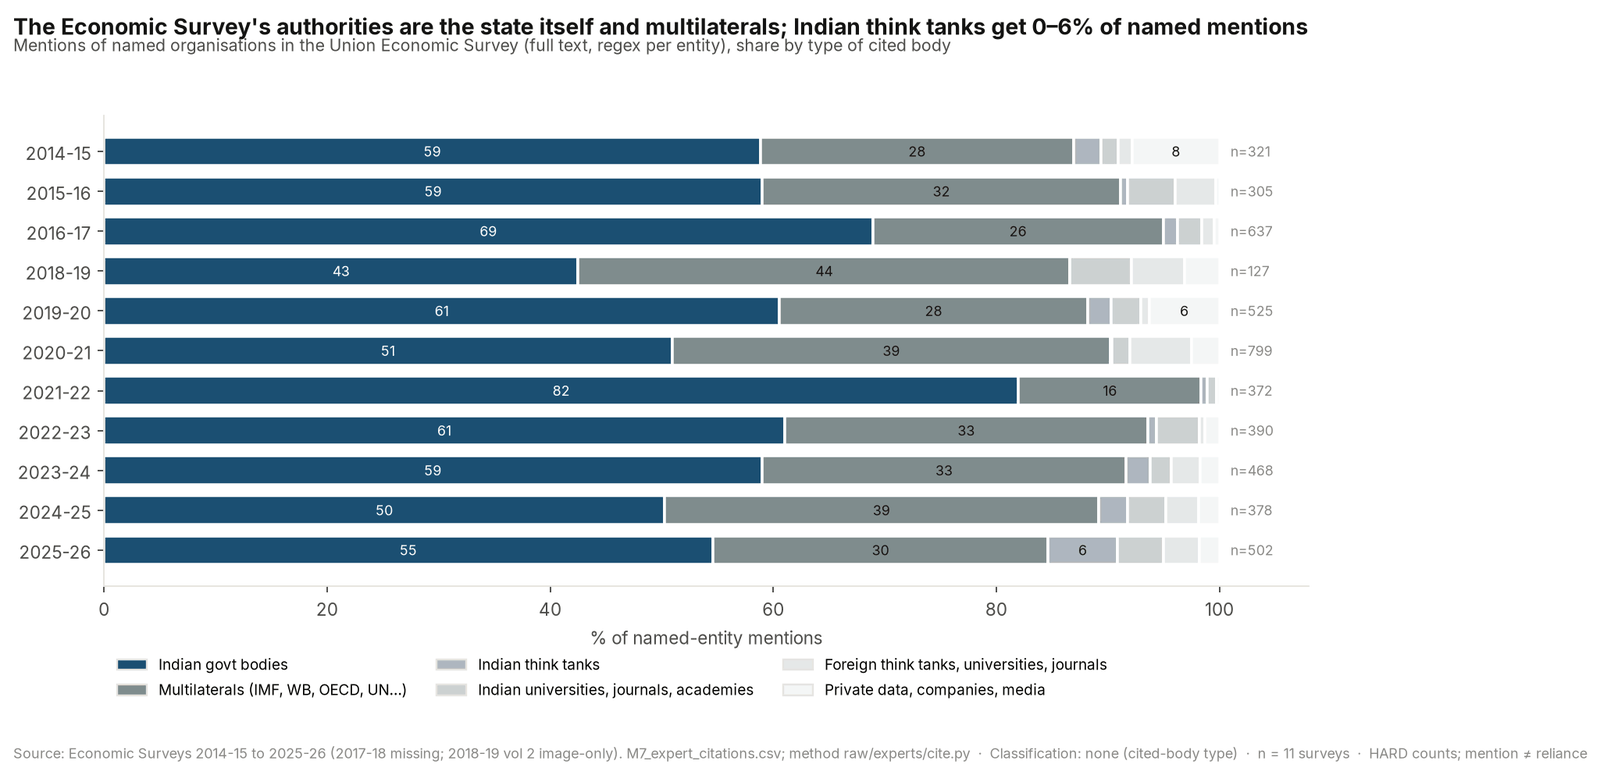
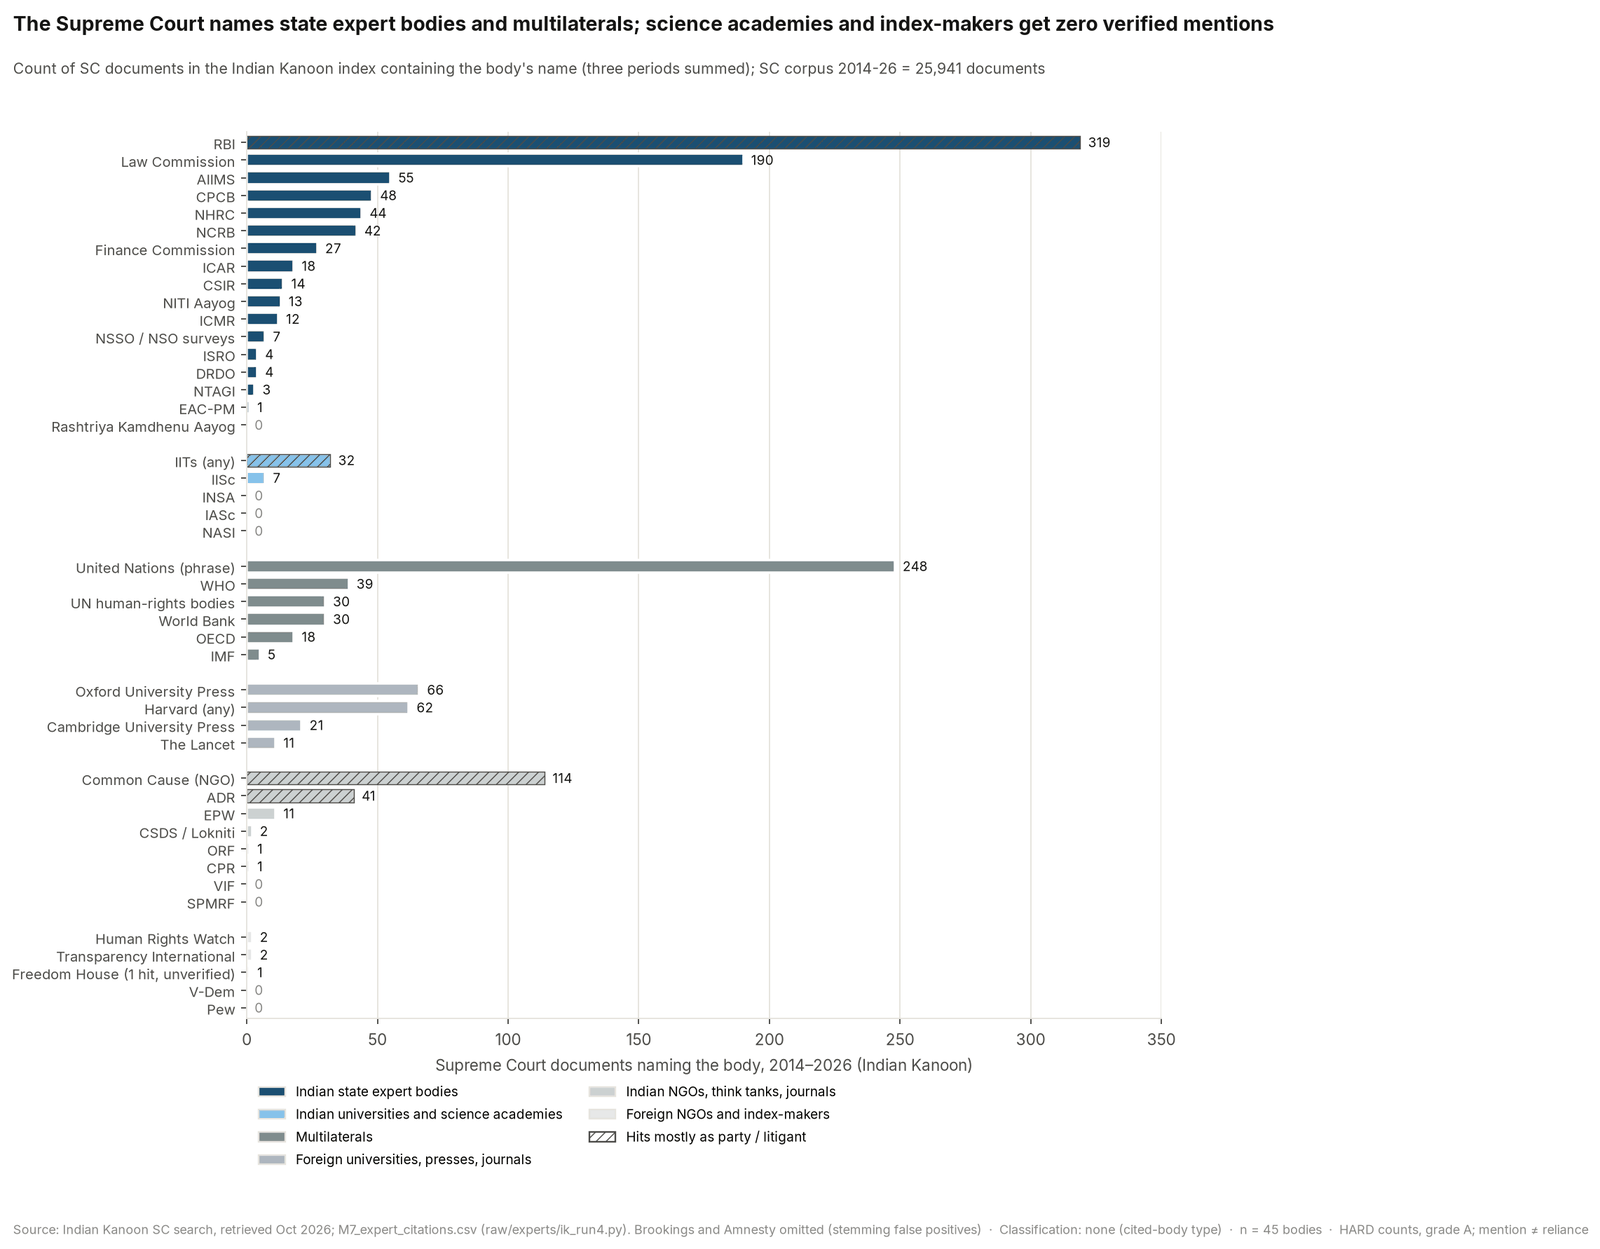
> Key findings > - The apparatus budgets ₹1,34,912 cr in BE 2026-27 across 12 departments (DERIVED, A); entity flow rows cover 99.4%. Defence R&D (₹29,100 cr) [EXP-0450], DST (₹28,049 cr, of which ₹20,000 cr is the RDI capital line) [EXP-0075] and DAE (₹24,124 cr) [EXP-0213] are 60% of it. > - Growth is uneven, and the fastest-growing line is AYUSH. Actuals 2014-15 → 2024-25 (HARD, A; ratios DERIVED): AYUSH ×6.67 (₹496 → ₹3,312 cr) [EXP-0288, 0318]; DHR/ICMR ×3.72; DAE ×2.79; DOS ×1.89; DST ×1.74; DBT ×1.46. Eight science departments: ×2.36 (₹25,139 → ₹59,307 cr), only +16.7% after 2019-20. DST spent ₹4,003 cr in 2023-24 vs ₹5,407 cr in 2019-20 (BE ₹7,931 cr) [EXP-0057, 0067, 0069]. > - The Economic Survey's authorities are the state and multilaterals. Across 11 Surveys, 4,824 named-entity mentions: Indian government bodies 59.5%, multilaterals 31.3%, Indian think tanks 1.8%, Indian science bodies (ISRO, ICMR, CSIR, DRDO, IITs, IISc, academies) 3.0% (DERIVED, A). Zero mentions in 12 years of V-Dem, Freedom House, Amnesty, HRW, Pew, CSDS, ADR, CBGA, SPMRF, Swarajya or Organiser. > - Courts name the Law Commission and the state's own bodies; science academies are invisible. In Supreme Court documents 2014-26 (Indian Kanoon, n = 25,941): Law Commission 190 (7.3 per 1,000), AIIMS 55, WHO 39, IITs 32 (mostly as party), ICMR 12, ISRO 4; INSA, IASc and NASI 0. No SC judgment verifiably cites V-Dem, Freedom House or Pew (HARD, A). > - Collisions run both ways, but the state holds the levers. NSC members resigned over a withheld jobs survey (2019) [EXP-0455]; the 2017-18 consumption survey was withheld [EXP-0457]; DST left the Science Congress, whose grant fell 68.5% (₹12.73 → ₹4.01 cr) [EXP-0406, 0412]; GoI called external excess-death estimates "purely speculative" [EXP-0499]; the NSC spent ₹0.70 cr of a ₹1.37–1.44 cr BE (A) [EXP-0502]. Opposition leaders attacked an IIT director (2026) and VC appointments (2024); 215 and ~180 academics objected [EXP-0474, 0491, 0513].
53.97.4 Whose expertise is cited (required table b)
Source: Atlas research module M7, “7.4 Whose expertise is cited (required table b)”.
In-text sources in 22 landmark SC judgments (sc_bodies.json; mentions / judgments): RBI 501 / 6 (demonetisation 417); law reviews 239 / 16; UN human-rights system 200 / 11; NITI/Planning Commission 45 / 4; WHO 22 / 2; Law Commission 20 / 4; Census 15 / 3; CSDS-Lokniti 11 / 1; ASI report 102 and the 1991 Historians' Report 9 (Ayodhya only); Quran/Hadith 525 / 9 and Vedas/Smritis/Gita 244 / 9. Science academies, ICMR and Indian policy think tanks are essentially absent. Foreign academic and UN sources cluster in the rights judgments (Puttaswamy, Navtej, marriage equality).